| set | condition | number_id | m_target | sd_target |
|---|---|---|---|---|
| 1 | Precise | 1 | 39057 | 47479 |
| 1 | Precise | 2 | 3777 | 2887 |
| 1 | Round | 1 | 38337 | 46651 |
| 1 | Round | 2 | 3833 | 2754 |
| 2 | Precise | 1 | 9841 | 11199 |
| 2 | Precise | 2 | 8337 | 9268 |
| 2 | Round | 1 | 9852 | 11141 |
| 2 | Round | 2 | 8433 | 9190 |
Original work
Nguyen, H. A., Hofman, J. M., & Goldstein, D. G. (2022). Round numbers can sharpen cognition. In Proceedings of the 2022 CHI Conference on Human Factors in Computing Systems (pp. 1-15).
Team BA autumn 2023
- Loris Adam
- Mika Berthel
- Joël Kämpf
- Joël Schrepfer
- Laura Staudenmann
- Cedric Thommen
- Sara von Allmen
Abstract
Scientists and journalists strive to report numbers with high precision to keep readers well-informed. Our work investigates whether this practice can backfire due to the cognitive costs of processing multi-digit precise numbers. In a pre-registered randomized experiment, we presented readers with several news stories containing numbers in either precise or round versions. We then measured their ability to approximately recall these numbers and make estimates based on what they read. Our results revealed a counterintuitive effect where reading round numbers helped people better approximate the precise values, while seeing precise numbers made them worse. We also conducted two surveys to elicit individual preferences for the ideal degree of rounding for numbers spanning seven orders of magnitude in various contexts. From the surveys, we found that people tended to prefer more precision when the rounding options contained only digits (e.g., “2,500,000”) than when they contained modifier terms (e.g., “2.5 million”). We conclude with a discussion of how these findings can be
Replication
We ran a direct replication of experiment 1 of Nguyen et al. (2022) and developed a set of six new tasks (see Appendix) that structurally followed the original: two numbers (either round or precise) and two additional numbers that were not relevant for the task. all six task were written in German den thematically centered on Switzerland mainly relying on the Swiss Statistical (BFS) and Health Services (BFG) as sources.
Generating stimuli is tricky - our set deviated quite a bit from the original. Set 1 had a average of 20008.8 for the first number and 2390, whereas set 2 had 8314.5 for the first and 3875 for the second number.
Let’s see whether these differences will get us the same set of results.
Demographics
The original paper had 1300 participants recruited on Amazon’s Mechanical Turk. We recruited through word of mouth among friends and family of the student group running this study, resulting in a substantially smaller sample.
Overall we collected data from 423 participants. Female participants (n = 238) were M = 26.5, SD = 11.6 years; Male participants (n = 171) were M = 33.5, SD = 17 years; non-binary participants (7) were M = 26.3, SD = 13.6 years old.
Experiment - Round versus precise
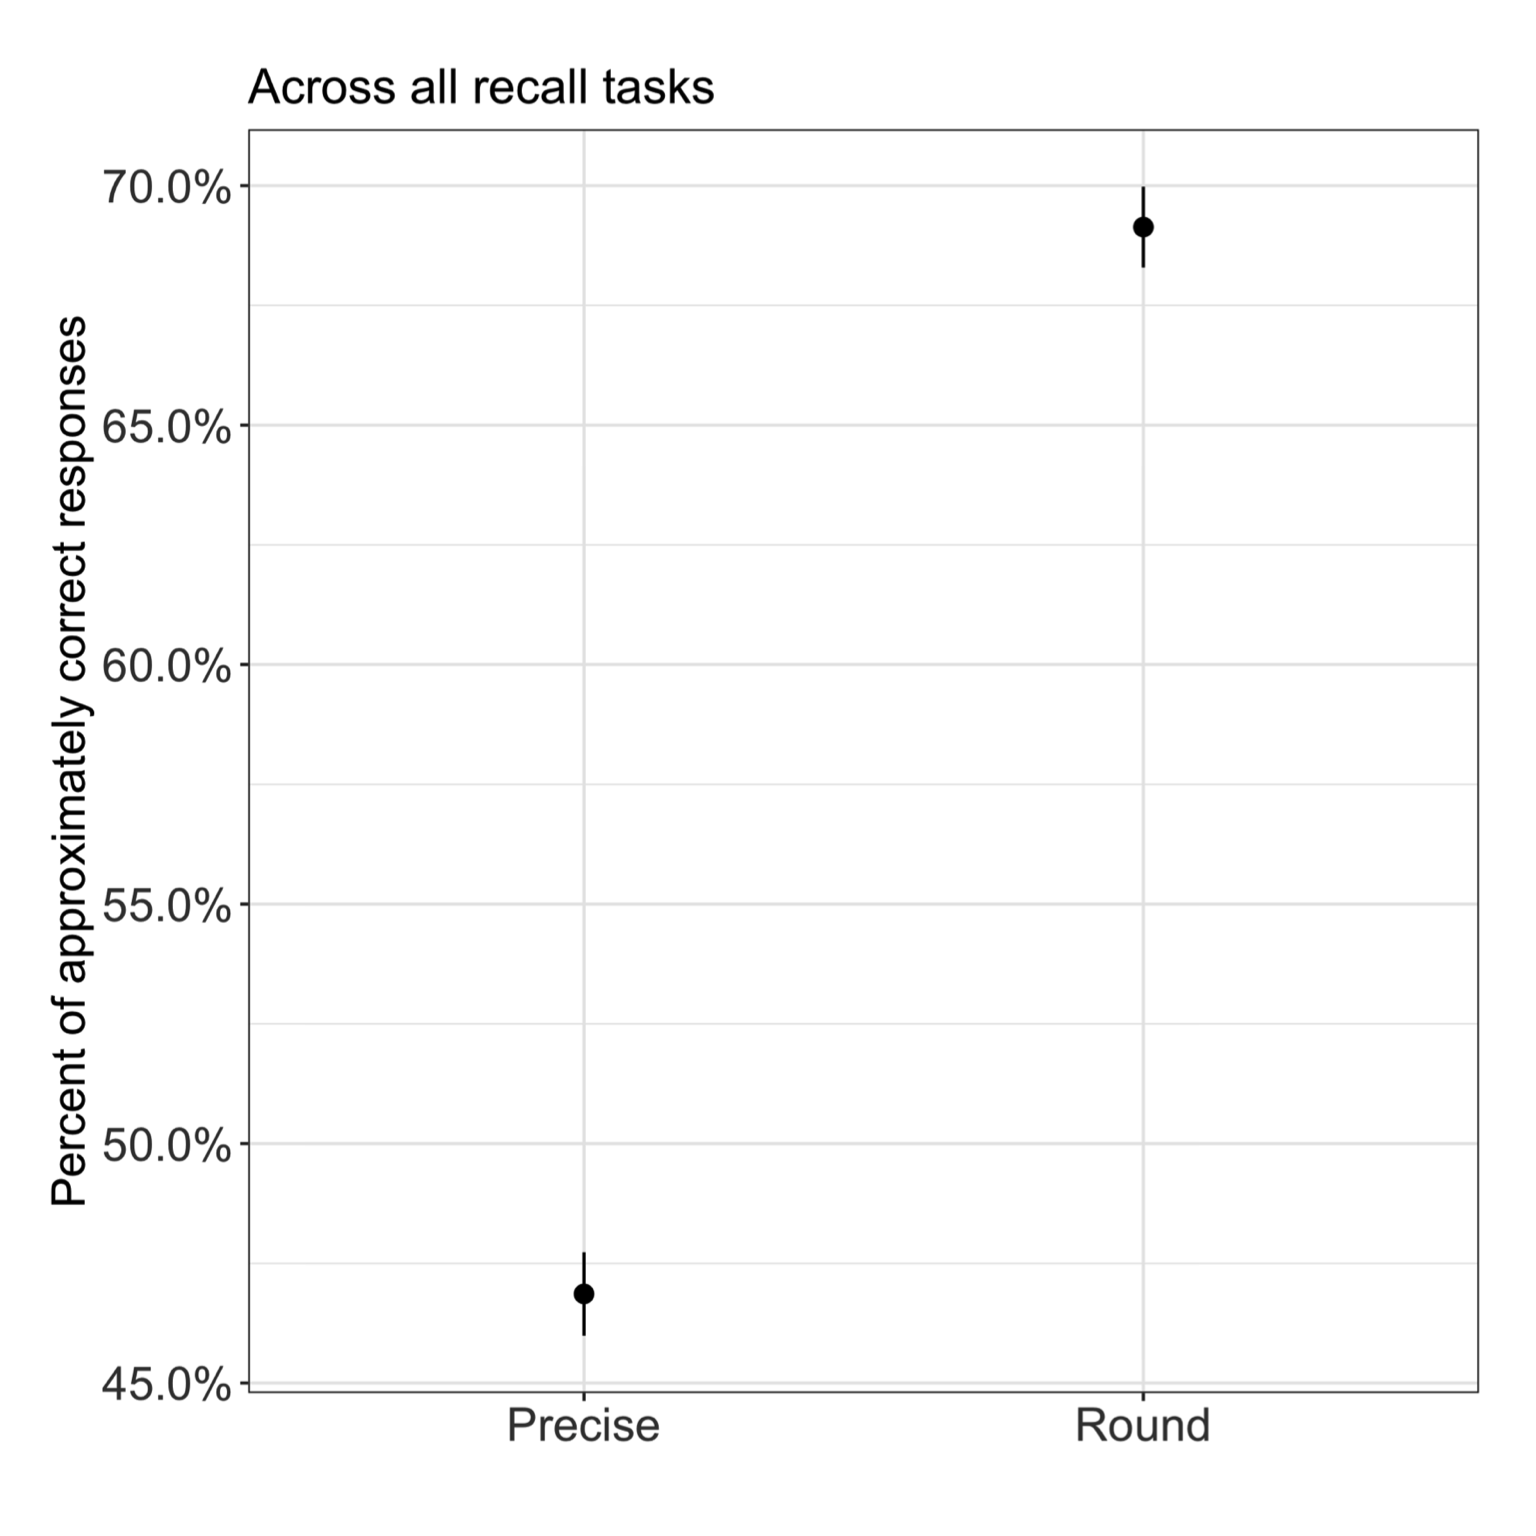
Let’s first look at the overall effect found in the original experiment - in Figure 1 we see an increase from Precise to Round of ~ 20 percentage points … that’s quite something.
Applying the same rule as Nguyen et al. (2022) we code all responses that fall within a 10% of the precise number as a correct response. Looking at the percentage of correct responses between the precise (0.6) and round (0.6) condition we see that the round condition has a ~ 7% higher percentage of correct responses than precise (see Figure 2).
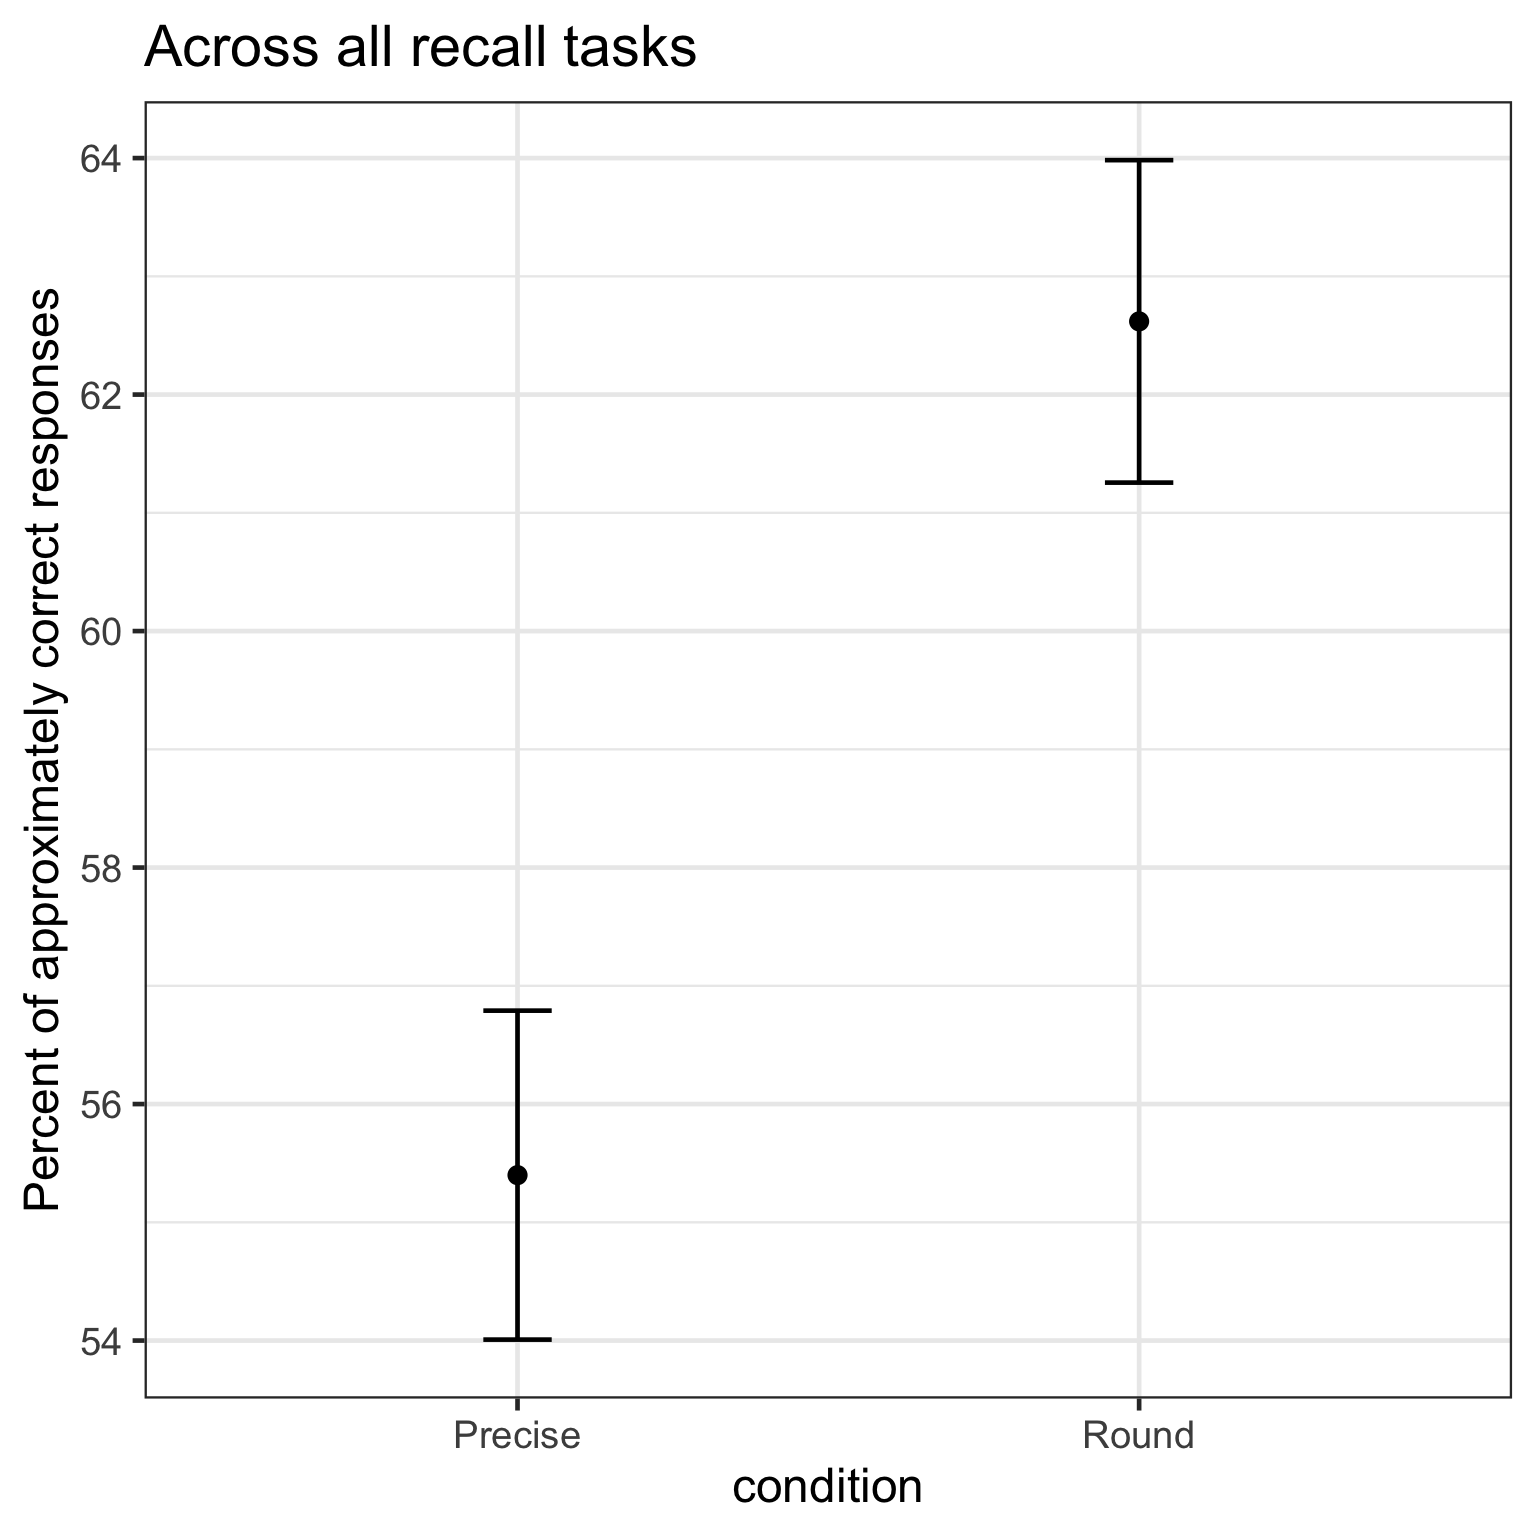
We run a simple Chi-2 test to see whether our ~ 7% still reach a significant difference -
    2-sample test for equality of proportions with continuity correction

data:  c(prop_table$n[2], prop_table$n[4]) out of c(prop_table$n[1] + prop_table$n[2], prop_table$n[3] + prop_table$n[4])
X-squared = 13, df = 1, p-value = 0.0003
alternative hypothesis: two.sided
95 percent confidence interval:
 -0.11 -0.03
sample estimates:
prop 1 prop 2
0.6 0.6 | check_within_range | |||
|---|---|---|---|
| Predictors | Estimates | CI | p |
| (Intercept) | 0.55 | 0.53 – 0.58 | <0.001 |
| condition [Round] | 0.07 | 0.03 – 0.11 | <0.001 |
| Observations | 2538 | ||
| R2 | 0.005 | ||
Split by task set
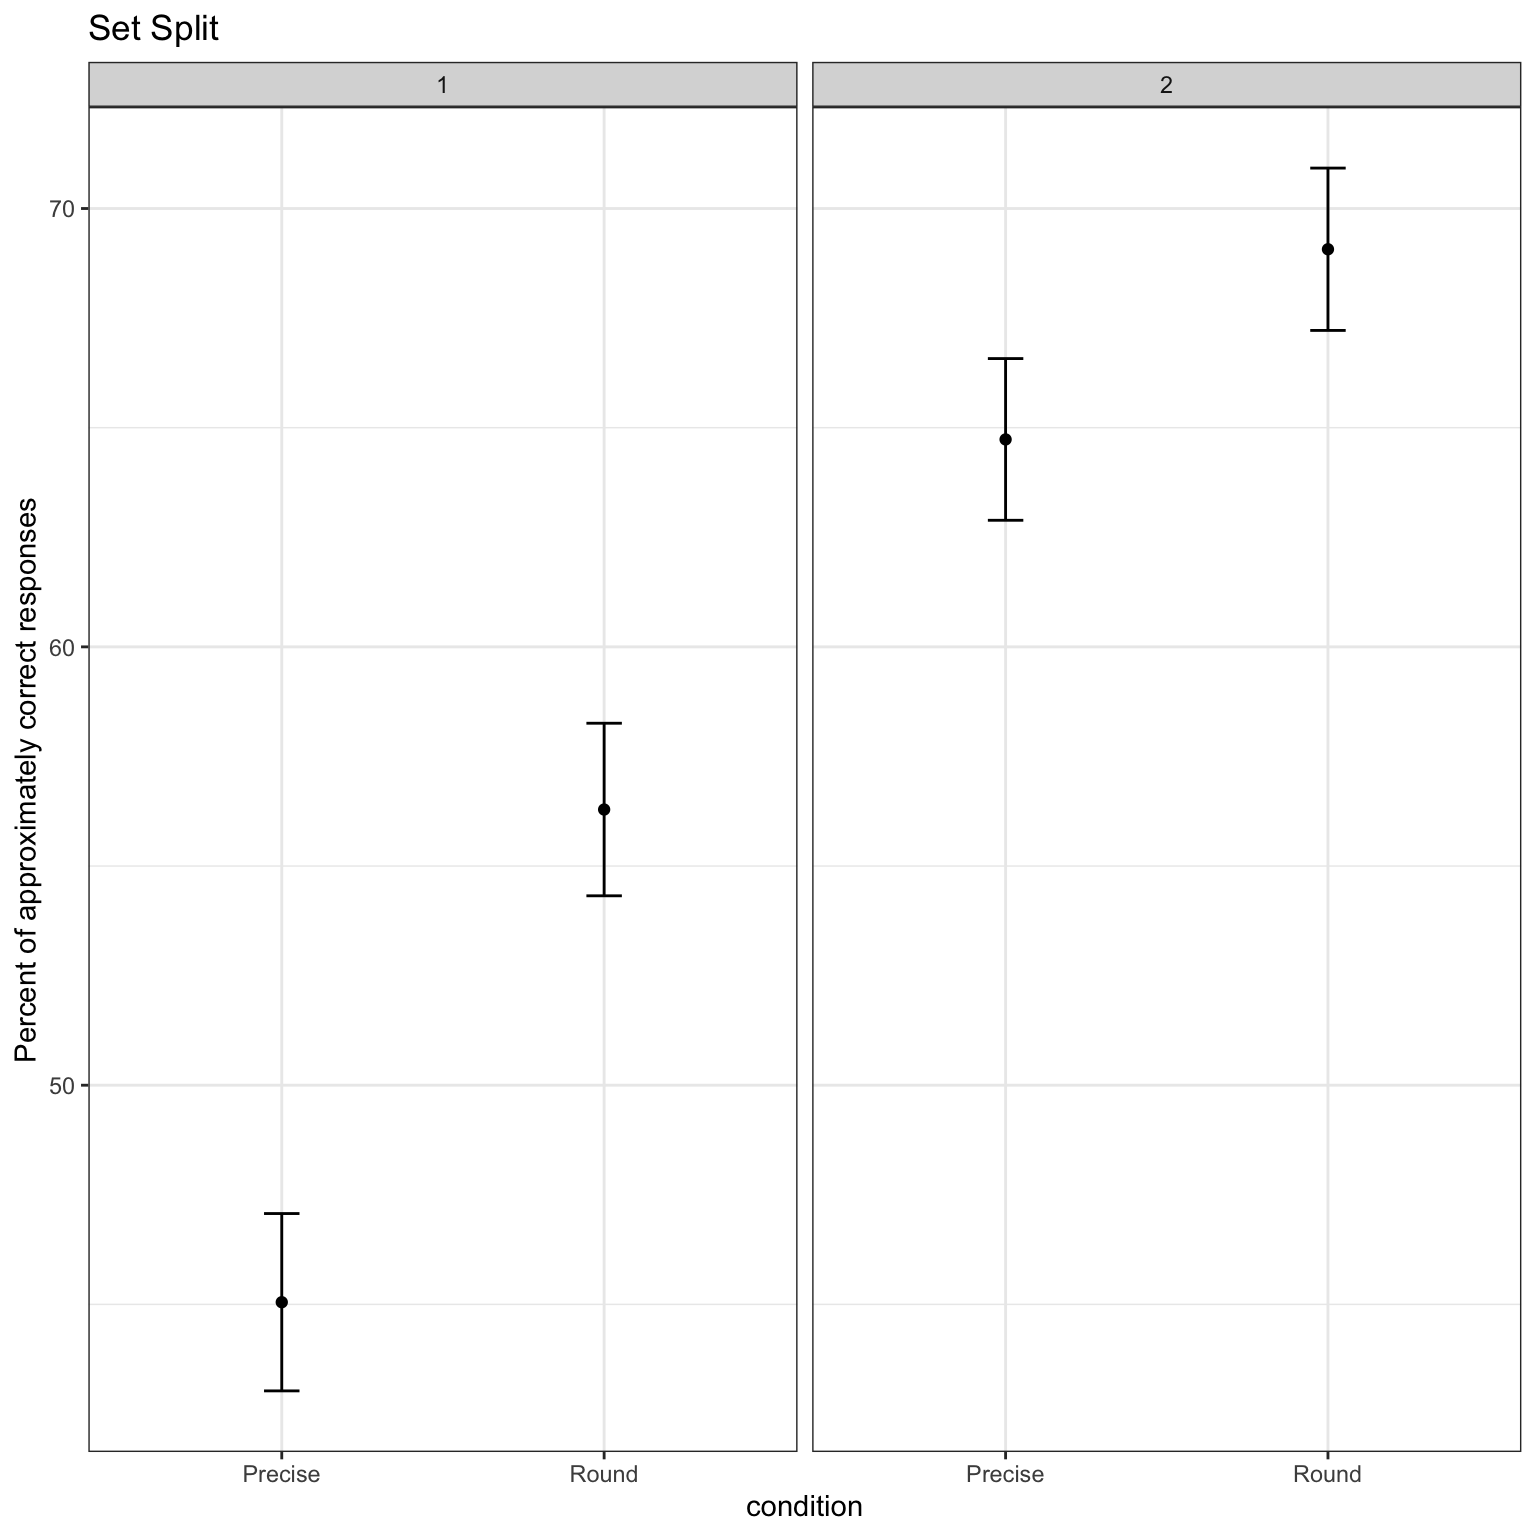
The overall effect is encouraging, but our two task sets differed considerably in the magnitude of the numbers used (see Appendix). Set 1 covered large administrative numbers (unemployment figures, court judgements, geographic areas), while Set 2 used more everyday-scale numbers (doctor’s offices, tunnel length, wages). If the round-number advantage is robust, it should appear in both sets — though we might expect set-specific variation given how differently the numbers were rounded (e.g., 103,156 → 100,000 is a coarser rounding than 16,942 → 17,000).
Figure 3 shows the condition effect separately for each task set.
All numbers
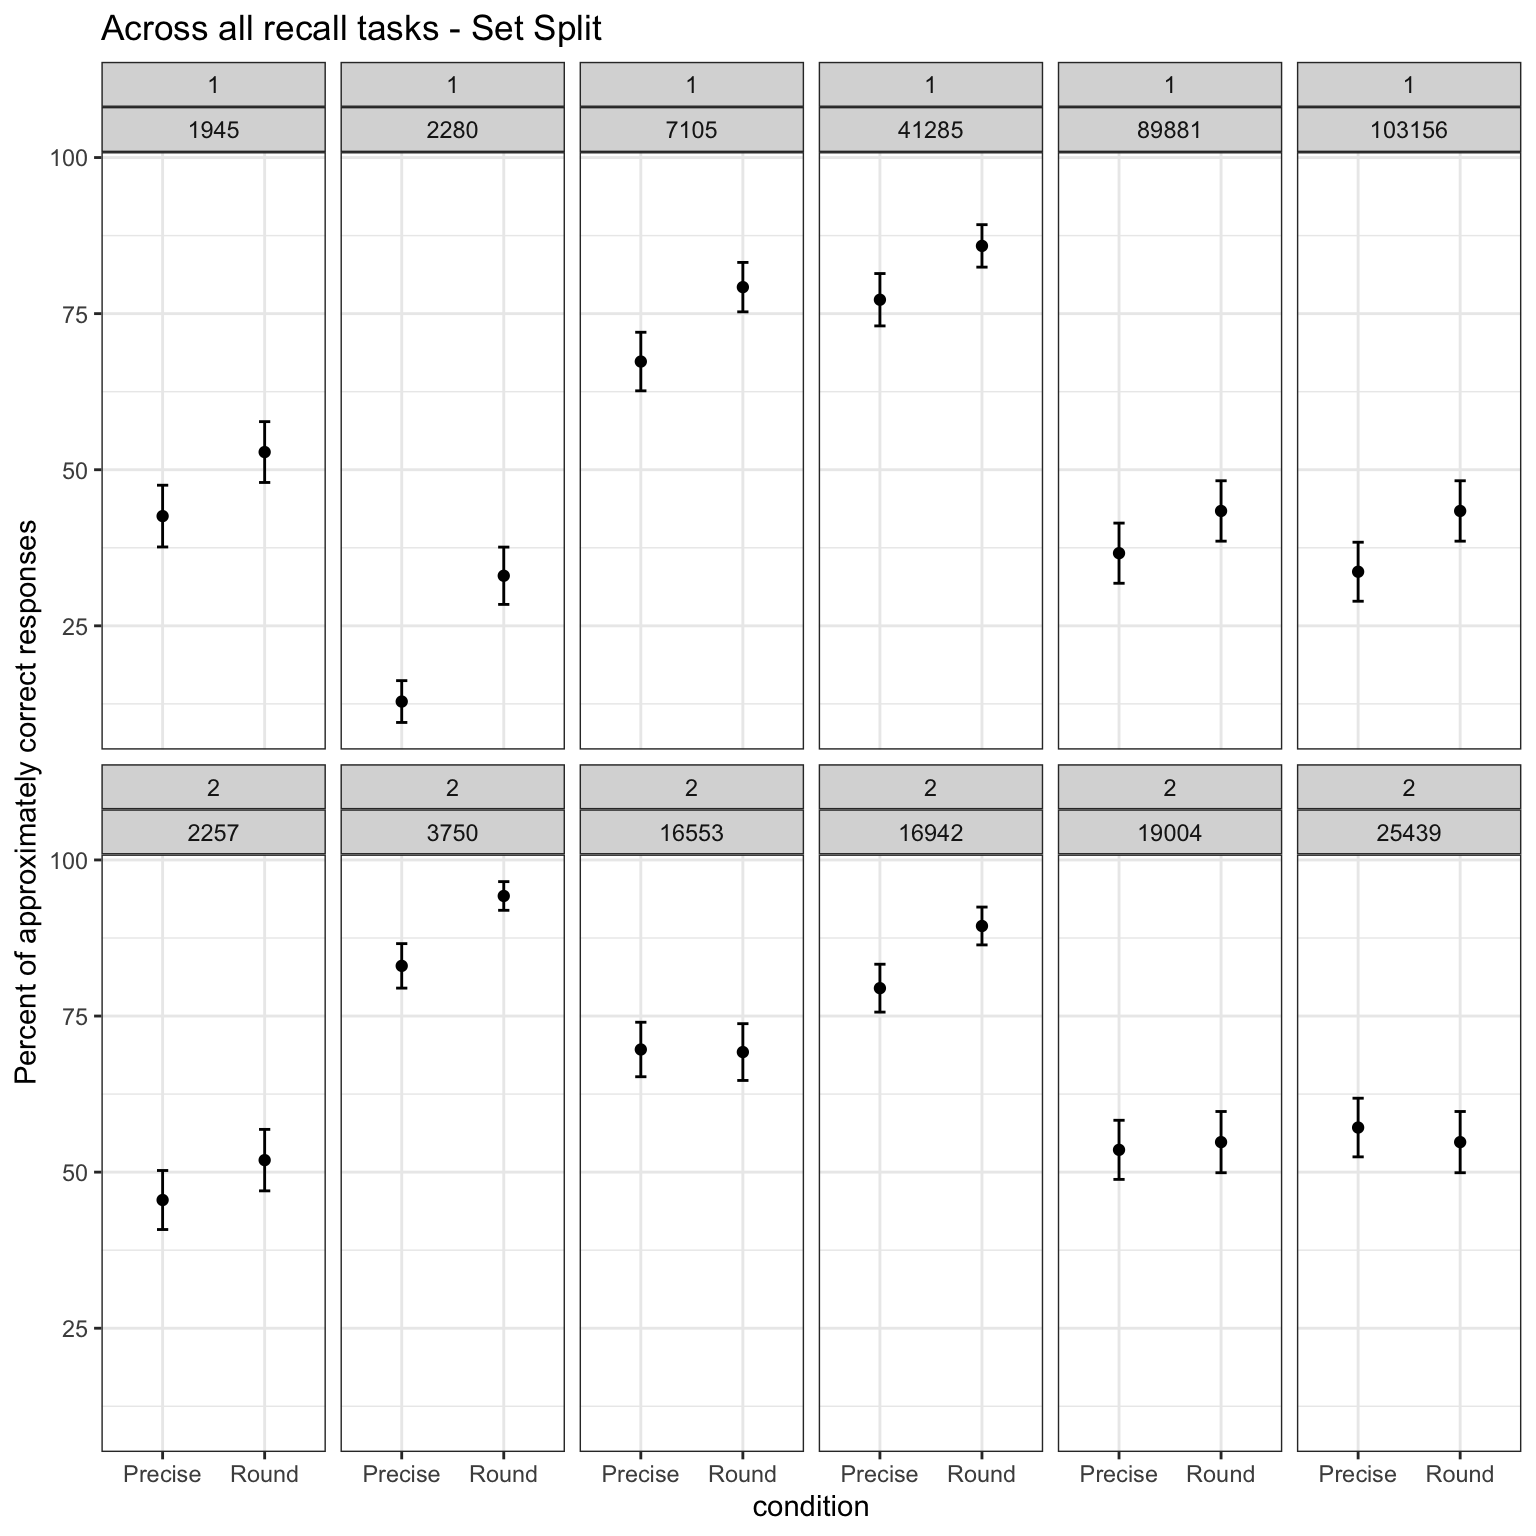
Beyond the set-level split, each individual number carries its own character — the precision of the rounding, the familiarity of the domain, and the scale of the value. Figure 4 breaks down performance by every individual number within each set and condition, giving us the most granular view of where the round-number benefit is clearest and where it is weakest or even absent.
This level of detail is useful for two reasons. First, it reveals whether a single hard or easy item is driving the overall result. Second, it allows us to inspect whether specific stimuli (e.g., numbers that were barely rounded vs. heavily rounded) behave differently — which would have implications for how future studies design their stimuli.
Appendix
Overview Task values
| Id | Set | Task | No 1 precise | No 1 rounded | No 2 precise | No 2 rounded | Target Percent precise | Percent rounded |
|---|---|---|---|---|---|---|---|---|
| 1 | 2 | Arztpraxen | 25’439 | 25’000 | 19’004 | 19’000 | 74.7 % | 76 % |
| 2 | 2 | Gotthardtunnel | 16’942 | 17’000 | 2’257 | 2’300 | 13.3 % | 13.5 % |
| 3 | 1 | Arbeitslosigkeit | 89’881 | 90’000 | 2’280 | 2’500 | 2.5 % | 2.8 % |
| 4 | 1 | Urteile | 103’156 | 100’000 | 1’945 | 2’000 | 1.9 % | 2.0% |
| 5 | 1 | Geographie | 41’285 | 40’000 | 7’105 | 7’000 | 17.2 % | 17.5 % |
| 6 | 2 | Umsatzlöhne | 16’553 | 17’000 | 3’750 | 4’000 | 22.7 % | 23.5 % |
Tasks in German
1. Arztpraxen
Jede vierte Ärztin bzw. Jeder vierte Arzt war Ende 2021 mindestens 60 Jahre alt. Ende 2021 waren in den Arztpraxen und ambulanten Zentren in der Schweiz 25’439 [25’000] Ärztinnen und Ärzte tätig, was 19’004 [19’000] Vollzeitäquivalenten entspricht. Gut 25% der Ärztinnen und Ärzte war mindestens 60 Jahre alt. Dies zeigen die jüngsten Ergebnisse des Bundesamtes für Statistik (BFS).
2. Gotthardtunnel
Der Gotthard-Strassentunnel ist mit 16’942 [17’000] Metern Länge der viertlängste Strassentunnel der Welt und der längste Strassentunnel in den Alpen. Die Autostrasse verbindet Göschenen im Kanton Uri mit Airolo im Kanton Tessin. Im Jahr 2012 wurde er durchschnittlich von 17’061 Fahrzeugen pro Tag befahren, wovon 2’257 [2’300] schwere Lkw waren.
3. Umsatzlöhne
Der Zürcher Gastronom Michel Péclard sorgte diesen Sommer mit einem neuen Lohnmodell für Aufsehen. Einem seiner Kellner bezahlte er 16’553 [17’000] Franken in einem Monat. Péclard setzt beim Servicepersonal seiner Restaurants auf Umsatzbeteiligung. Der Toplohn sei zwar eine Ausnahme gewesen. Doch seine Angestellten hätten im Sommer monatlich zwischen 8’000 und 12’000 Franken verdient – weit über dem garantierten Mindestlohn von 3’750 [4’000] Franken für Ungelernte.
4. Arbeitslosigkeit
Gemäss den Erhebungen des Staatssekretariats für Wirtschaft (SECO) waren Ende August diesen Jahres 89’881 [90’000] Arbeitslose bei den Regionalen Arbeitsvermittlungszentren (RAV) eingeschrieben, 2’280 [2’500] mehr als im Vormonat. Die Arbeitslosenquote stieg von 1,9 % im Juli auf 2,0 % im Berichtsmonat.
5. Erwachsenenstrafurteile
Im letzten Jahr ist die Zahl der Strafregistereinträge gegenüber dem Vorjahr um 3% auf 103’156 [103’000] Verurteilungen gestiegen. Die Verstösse aufgrund des Strassenverkehrsgesetzes erhöhten sich leicht, jene aufgrund des Betäubungsmittelgesetzes gingen um 13% zurück. Insgesamt wurden 1’945 [2’000] Landesverweisungen ausgesprochen.
6. Geographie
Mit einer Fläche von 41’285 [40’000] Quadratkilometern ist die Schweiz von allen Ländern Europas eines der flächenmäßig kleineren. Der Binnenstaat in Mitteleuropa grenzt an Deutschland, Österreich, Liechtenstein, Frankreich und Italien und hat Anteil an drei großen europäischen Sprachräumen (Deutsch, Italienisch, Französisch). Das Land ist aufgeteilt in 26 teilsouveräne Kantone. Graubünden ist mit einer Fläche von 7’105 [7’000] Quadratkilometern der größte, der Kanton Basel-Stadt mit rund 37 Quadratkilometern der kleinste.
Data
The anonymised responses behind every figure and table on this page, each file keyed on the participant’s random ID:
BAHS2023_complete_df_pub.csv: one row per participant, task and number, with thetask, thecondition(RoundorPrecise), whether the row comes from the recall or the estimation part (test), which of the two numbers it refers to (number_id), thevaluegiven and thetargetit should approximate.BAHS2023_targets_pub.csv: the stimulus values, one row per task and number – thetarget, itssetandlabeland therange_min/range_maxof the answer scale.BAHS2023_demographie_pub.csv: year of birth (Jahrgang), gender (Geschlecht) and age (Alter) per participant.